Mining Ropes Wire Rope Flaw Detector Cableway Elevator Wire Rope
Flaw Detector Steel Rope Flaw Detector
1. Specifications
Standards: GB/T21837-2008, ASTM E1571-2001 (Standard specification
for electromagnetic examination of ferromagnetic steel wire rope),
GB/T5972-2006/ISO 4309:90, GB8918—2006
Detecting range:Φ1.5—300 mm (choose different sensor)
Relative velocity between sensor and wire rope:0.0—6.0 m/s Best
choice:0.3—1.5 m/s
Best gap between guide sleeve and wire rope: 2—6 mm,allowed
gap:0—15mm
Output file type: Word files output
Alarm: Sound and light alarm
Broken wire rope location(LF)detection
Qualitative judgement accuracy: 99.99%
Quantitative assessment
Repeatability error of Sensitivity: ±0.055%
Display error: ±0.2%
Error of location detection,(L): ±0.2%
Power:5V computer power supply
WEIGHT OF SENSOR: < 10kg (Regular sensor)
Environment temp.-10℃~40℃
Air pressure:86~106Kpa
Relativity humidity:≤85%
The windows system of wire rope computer detector is the GB system
renewal product which based on the DOS software theory and the real
time display alarm guiding ideology utilizes Visual Basic6.0 the
programming language foundation, carries on the compilation to
become.
This system hardware part uses the domestic and foreign advanced
magnetic sensor and the independent research and development
sampling module unifies, through RS232 (or USB) main line driving,
directly storage data in computer.
This system software part is in the wavelet transformation analysis
foundation, in utilizing Visual Basic 6.0 programming language
foundation, carries on the compilation to become. Achieve the
functions such as data acquisition and control, data analysis, data
display, data storage and so on. Increase the visible
characteristic in the DOS software function, and by its unique
tendency continuously to track the way, may continuously, the
dynamic observed data signal and its the change situation, and the
real time display obtained result and sends out the alarm; Software
increased the automatic evaluation function; In the partial flaw
demonstrated on increased cross section and the total sectional
area percentage; Software and Windows are completely compatible,
suits to user's inertia operation, uses the Word files form
production examination report.
This system software may compatible wire rope computer detector DOS
software sampling data format, and can analysis processing to it.
The windows system took an independent operating procedure and the
safe examination system, can conveniently be suitable for each kind
of modern computer, and completes a series of examinations
procedure.
2. Systems Demand
2.1 Computers Hardware Disposition Demand:
Processor: Above Celeron 1.5GHZ
Memory: 128MB
Hard disk: 10G
Connection: RS232 or USB
Monitor: Above VGA
2.2 Software Environment Demand:
- This system supports the Windows XP, Windows 7, Linux etc operating
system;
- Need install Microsoft office word platform.
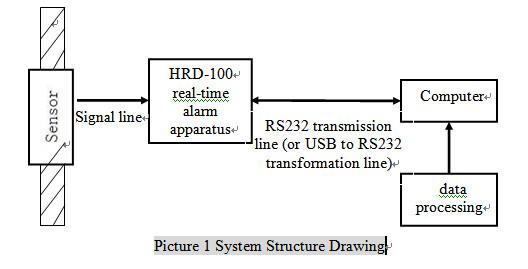
2.3 System Disposition
| Magnetic sensor (including distance locator) | A group |
| HUATEC HRD-100 real-time alarm apparatus | One |
| Signal connection line | One |
| RS232 transmission line (or USB to RS232 transformation line) | One |
| windows special-purpose software package | One |
| Computer | One |
3. Sensor introduction
Magnetic sensor: The sensor is composed by displacement locator
(Leading wheel, encoder), the magnetization installation and the
sampling organization. After the system activated, the wire rope
and it has the relative movement, then it can gather the signal.
Displacement locator: Leading wheel rotated a circle, the
photoelectric encoder sends out the sampling instruction pulse,
realizing equal space sampling.
Magnetization installation: When the wire rope and it has the
relative movement, completes to the wire rope axial magnetization.
Sampling organization: When the wire rope and the sensor have the
relative movement, the Hall element composed the sampling channel
will transform the wire rope magnetic flux leakage change condition
into the simulation voltage signal.
4. HUATEC real-time alarm apparatus
The HUATEC real-time alarm apparatus is a portable multi-purpose
data acquisition, through the RS232 transmission line to send and
save the converted data signal to the computer, make use of the
computer CPU formidable function on-line and real-time processing
analysis, according to the equivalent threshold value which will
set in advance sends out the real-time alarm. One group to give the
sensor power supply lithium battery group, the output is 5V. There
is an addition charge port to be possible to supply the charge and
the power switch.
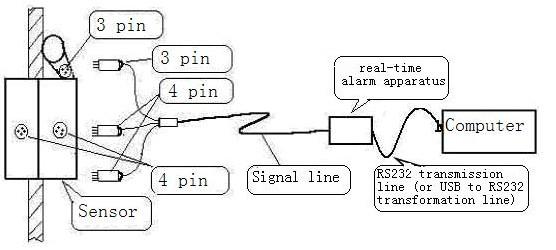
Picture 2 Signal Sampling Wiring Diagram
5. Software introduction
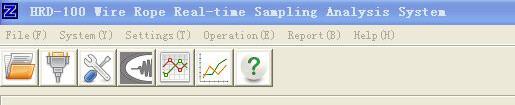
Picture 3 Main Functions Items
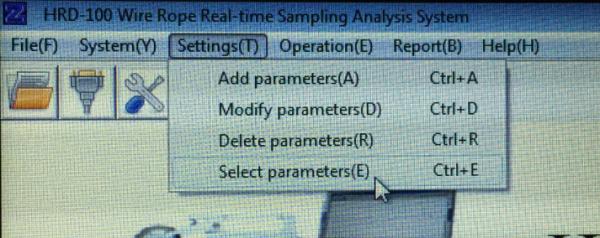
Picture 8 Parameter Settings
6. Broken wire analysis
Broken wire analysis (Ctrl+N) is the man-machine dialogue
procedure, is the analysis processing function item for the test
data. Two methods can enter this procedure: One is directly
entering the human body dialogue according to preceding; Another is
"open" way to enter, click on operating column "broken wire analysis" item (or click on tool column icon button) to enter the operating
sequence, or click on “file" column "open" item, the inquiry window will pop, click on "analysis" item to enter the operating sequence.

Picture 11 Broken Wire Analysis Interface Picture
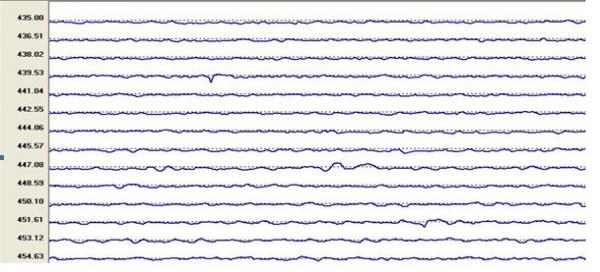
Broken wire analysis (man-machine dialogue) the surface
introduction that:
- In the procedure window, center is the data wave form display
picture, a screen altogether displays 16 lines, and each line
altogether displays 512 sampling spots.
- Display window two sides numerals are both distance display: Left
is this wave form corresponding testing starting location; Right is
total this wave form corresponding testing displacement between the
starting and ending location.
- Two page numbers under the display window: One is the total page
number; the other is the current page number.
- There are several buttons in the middle of the two page numbers,
when the total page number is not more than 1, there are two
buttons, “Analyze automatic” and “Analyze artificial”, when the total page number is over 1, there will add one: “Next”. Click on “Analyze automatic”, the system will judge the red marked spot and calculate each
partial flaw result according parameter that select (for example
broken wire equivalent number or proportion of cross-sectional area
to total cross-sectional area); Click on “Analyze artificial”, the system will mark all suspicious wave signal points, the
points will be confirmed or removed by the experienced operator,
the system will write up report according to judgment result. The
two operations will only be aimed at the current page, must
reselect operating mode after the page turning. “Next” mainly is used in turning the page, will only be able to turn one
page to next page, the earlier pages will be not able to view
before judging ending. Dragging the roll to scan the earlier pages
will be allowed only after judging ending, but amending is not
allowed.
- There a row display below the buttons, left side is the route and
name of the file opened this time; the middle is the LMA0 value,
this value is the reference value of cross-sectional areas
automatically calculated by the system for this group of data, is
on basis of the first row average of this data wave form. In
calibrating process it just need to fill in cross-sectional area
parameter column, the system will evaluate processing analyzing
data the metallic cross-sectional area changing (for example
deterioration) according the LMA0 value.
- When use artificial analysis, a group of VPP value appears in right
and bottom, namely former crest to crest value and latter crest to
crest value of this wave form partial abnormity signal in the
location marked in red spot in display window. When use the
automatic analysis, this value will not appear.
Broken wire analysis procedure as follows:
- Select a group of parameter to suit this evaluation, if there is no
suitable one to be possible to add or amend, and confirm the
selection to use.
- Enter the procedure according to the above operating procedure, a
“Select data file” window will pop, and click on prepared analyzing
processing data file, open to enter the procedure item.
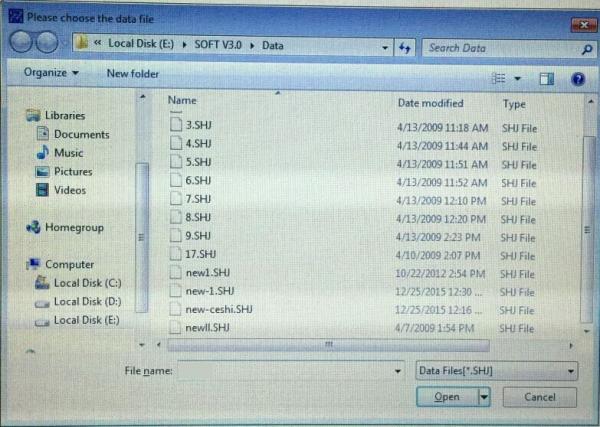
Picture 12 Data Selection File Window
- The system will act according to the parameter logarithm which will
elect according to carry on the automatic scan, when the partial
flaw signal two crests values mean value will be bigger than first
threshold value, will carry on the sign note to this place, and
will give the sign note to this page all similar situations.
- Each point will be confirmed or removed by the experienced
operator, and the slack strand, jumping wire, deformation and other
flaws of the wire rope may be judged from the testing wave form.
Pay attention to isosceles triangle whose two crests values the
data difference is not big, and wave form crest is similar to acute
angle. The concrete flaw characteristic and the evaluation detailed
knowledge may be seen in the chapter 6, the flaws analysis and the
evaluation.
- When the operator has no different opinion on the marked red spots
in current page screen, and judge them broken wire, directly click
on "Analyze automatic" button. All the marked red spots in this page will be confirmed
for broken wire, the system will automatic calculate quantification
value in each place, and display the value list in the result
report. Click on "Next" button to turn page and operate again.
- When the operator has different opinion according to flaw signal on
part of the marked red spots in current page screen, must reject
the part, and will have to use artificial analysis evaluation
procedure. Directly click on "Analyze automatic" button to enter the artificial analysis procedure. All red spot
mark will be scanned one by one in the current page, when scanning
to some a spot, the mark color will turn black, and its VPP will
appear in right below, and a dialogue window will pop and inquire
whether this mark is broken wire. If judge it broken wire, click on
"Yes" in the window, and the marked spot will assume red; If it is not,
reject it, then click on "No", the marked spot will assume yellow. Also may use the fast key to
judge that, if confirm, press "Y" (or press the “Enter” key), if
deny, press "N". When need continuously confirmation or denying,
long press "Y" (press the “Enter” key) or "N" continuously
similarly judge.
- When the operator has different opinion according to flaw signal on
all the marked red spots in current page screen, all will give them
all denying, long press "N" key. When this group of data have the
multi- pages screen, may directly click on the next page to give
the full page denying and to enter the next page of screen, so all
the marked in this page will be denied, and no longer enter in the
judging result, but last the page cannot so, only be able to long
press "Y" or "N" according to the above method.
- After each page analysis ending, two buttons assume excessiveness.
- If the result report needs to be analyzed and evaluated this time,
must when the analysis evaluation ends, immediately enter report
column and click “broken wire report” item, open and view the result report.
- After assigning out data file, may continue to reselect data file
that need analysis.
7. Deterioration analysis
The deterioration analysis (Ctrl+L) is evaluation procedure to the
testing wire rope metallic cross-sectional area change (for example
deterioration), is an automatic evaluation function item for the
test data according to a datum value. Click on “Deterioration analysis” in operating column (or direct use fast key) to enter the
operation sequence (As Picture 13).
Picture 13 Deterioration Analysis Interface Picture
Deterioration analysis interface introduction:
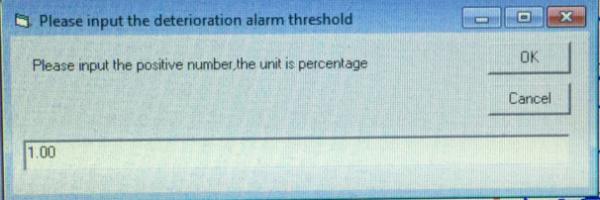
- When enter the procedure, a “deterioration warning threshold” window will pop (like Picture 14), input a positive number in the
blank space according to each profession standard specification
limiting value, or according to one’s own requirement. The
procedure will rest on this value will calibrate the result
according to metallic cross-sectional area reduce (for example
deterioration). When the result surpasses this value, color of
deterioration percentage in right surface will turn red. The wave
form data result that assumes red will be recorded in the
deterioration report.
Picture 14 Data Selection File Window
- In the procedure window, center is the data wave form display
picture, a screen altogether displays 16 lines, and each line
altogether displays 512 sampling spots.
- Display window two sides numerals are both distance display: Left
is this wave form corresponding testing starting location; Right is
the increasing or decreasing percentage of this wave form
corresponding the metallic cross-sectional area datum value, namely
LMA change percentage.
- There are several buttons in the middle of the two page numbers,
when the total page number is not more than 1, there are two
buttons, “Print current page” and “Printing OK”, when the total page number is over 1, there will add two: “Back” and “Next”. “Print current page” is that, regarding the current page graph, click on "the printing
current page" button, regarding each current page in requirement,
may click on this button; “Enter” is the button to confirm to print the page in requirement. Each
A4 paper may print two screens, may print all the pages in waiting
in turns. When just one screen need to be printed, may click on “Print current page” first, and click on “Enter”, the current page will be printed immediately. “Back” and “Next” is the function buttons that used in turning page.
- There a row display below the buttons, left side is the route and
name of the file opened this time; in the middle it displays the
cross-sectional area datum value, the system will evaluate
processing analyzing data the metallic cross-sectional area
changing (for example deterioration) according this value.
Deterioration analysis concrete sequence of operation as follows:
- Click on "Deterioration analysis" in operating column, "deterioration warning threshold" window will pop, according to one own requirement or each
profession standard, input with a value in the blank space, and
confirm.
- After inputting the parameter, a primary data folder will pop.
Select the file that needs to be analyzed and open it.
- The surface will display this file data wave form, and display each
position section corresponding metallic cross-sectional area
changing. If the metallic cross-sectional area changing surpasses
the supposing value, the number in right surface turn red reports
to warn, this section corresponding wave form spot position, the
conclusion position and the greatest value of this section
reduction will be recorded in the report.
- Regarding each current page in requirement, may click on “Print current page”,When all the pages in requirement are selected, click on “Printing OK” and enter the printing procedure.
Attention: When click on the printing, in advance connect the
printer and the computer, and set the printer which connects as
default printer.
8. Sensor option
| Sensor | Diameter of wire rope | Best detection range |
| HUATEC-F5 | ≤5mm | 2~5mm |
| HUATEC-F10 | ≤10mm | 5~10mm |
| HUATEC-F15 | ≤15mm | 8~15mm |
| HUATEC-F20 | ≤20mm | 10~20mm |
| HUATEC-F25 | ≤25mm | 15~25mm |
| HUATEC-F30 | ≤30mm | 20~30mm |
| HUATEC-F35 | ≤35mm | 15~35mm |
| HUATEC-F40 | ≤40mm | 30~40mm |
| HUATEC-S45 | ≤45mm | 35~45mm |
| Other sensor can be customized production |

